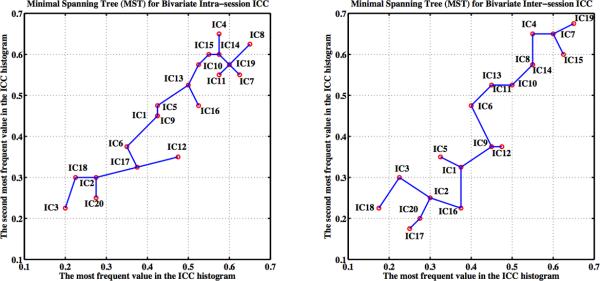
Figure 8. Ranking and Ordering the Test-Retest Reliability Maps Using Their Bivariate Minimal Spanning Tree Representations.
For both intra-session (left) and inter-session (right) reliability, based on the bivariate feature (i.e., red circles) of each ICC histogram with 80 bins, a fully connected graph can be built. A minimal spanning tree (MST) of this graph is a tree sub-graph that contains all nodes and whose edges have the least total distance. The components are ranked by walking along the MST of the corresponding graph constrained with a rule. The rule defines a starting node at an endpoint of a tree diameter and then to proceed through the tree in such a way as to visit any shallow sub-trees at a given node before proceeding to the deeper sub-trees. In our situation, we choose to begin on the right (i.e., large test-retest reliability) of the MST and use the ordering rule to get the final ranks for these group-level components.

