Fig. 3.
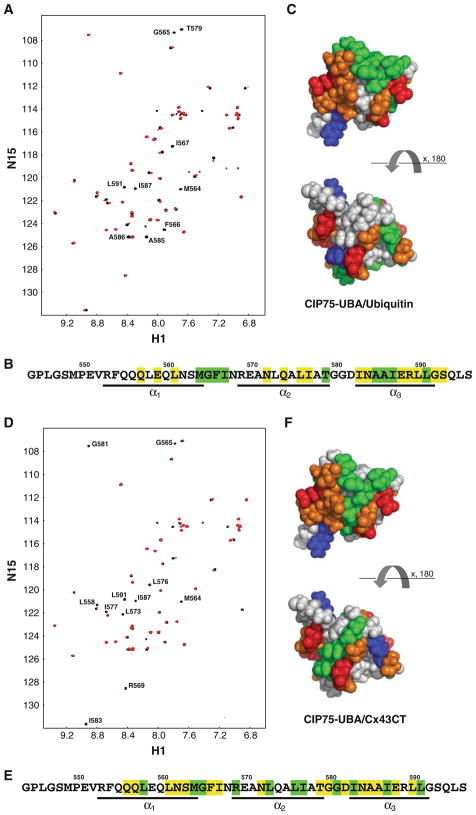
Interaction of the CIP75 UBA domain with ubiquitin and the Cx43CT domain. A. The CIP75 UBA domain was titrated with ubiquitin to a 1:1 M ratio. The control spectrum, UBA only (black), has been overlapped with a spectrum obtained when both molecules were present at a 1:1 M ratio (red). The resonance peaks that completely disappeared have been labeled. B. A summary of all the UBA residues affected by ubiquitin. Residues which completely disappeared or slightly disappeared/shifted are colored in green and yellow, respectively. Residues comprising the three α-helices are underlined. C. Hydrophobic surface view of the CIP75 UBA domain with the UBA residues which completely disappeared in the presence of ubiquitin colored in green. Hydrophobic residues (A, G, F, I, L, M, P, V) are colored grey, negatively charged residues (D, E) in red, positively charged (K, R) in blue, and polar residues (N, Q, S, T, Y, H) in orange. D. The CIP75 UBA domain was titrated with Cx43CT to a 1:20 M ratio. The control spectrum, UBA only (black), has been overlapped with a spectrum obtained when both molecules were present at a 1:20 M ratio (red). The resonance peaks that completely disappeared have been labeled. E. A summary of all the UBA residues affected by the Cx43CT domain. F. Hydrophobic surface view of the CIP75 UBA domain with the UBA residues which completely disappeared in the presence of Cx43CT colored in green

