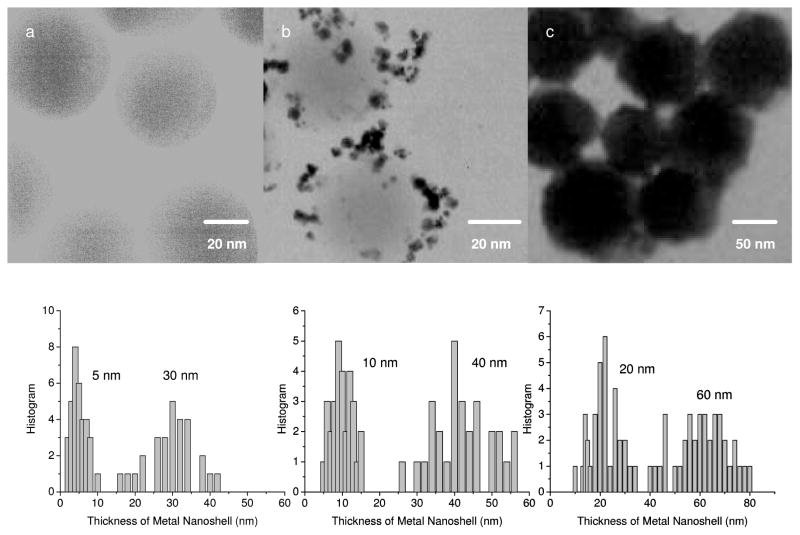
Figure 1.
Upper panel: TEM images of (a) silica spheres, (b) silver-seeded silica spheres, and (c) 30 nm thick silver nanoshells. Bottom panel: statistical distributions of metal shell thickness that were estimated by the substation of silica sphere radius (25 nm) from the metal particle radius on the TEM images. At lease 20 metal nanoparticle images were treated for each sample.

