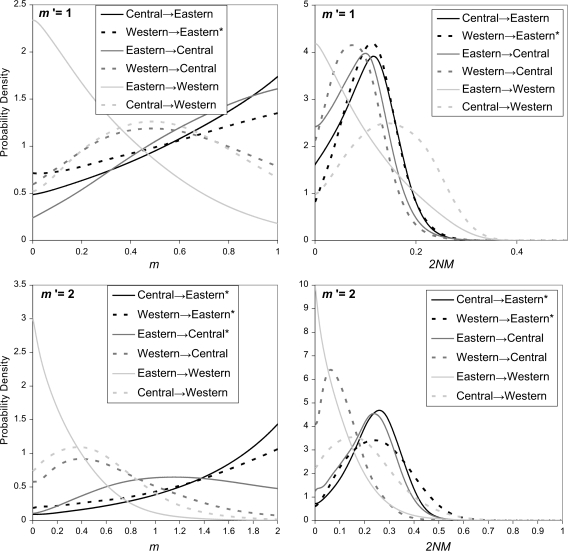
FIG. 4.
Estimated marginal posterior densities for m and 2NM for period 1 in three-population models for the common chimpanzee. Curves for m are shown on the left and for 2NM on the right. Curves generated under a uniform prior with an upper bound of m′ = 1 are shown on the top and curves generated with m′ = 2 are shown on the bottom.

