FIG. 2.
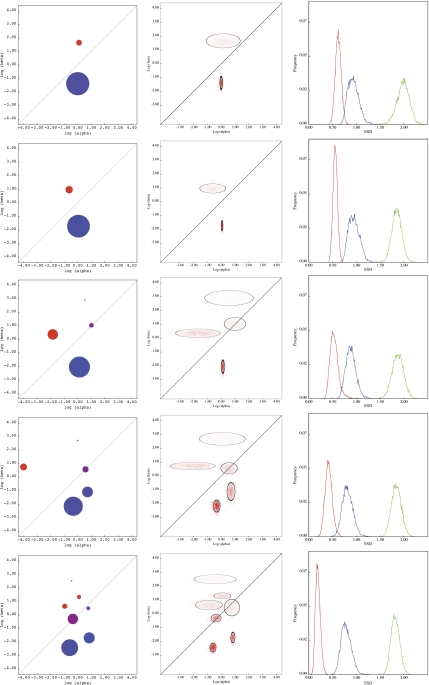
Evolutionary fingerprints of IAV HA alignments of varying sizes (10, 25, 50, 100, and 349 sequences top to bottom). The left panel shows point ML estimates. The middle panel depicts the approximate sampling distributions; color intensity reflects the density assigned to a particular square of the rate distribution; the ellipses are centered on approximate sampling means of corresponding rate estimates, and each axis is drawn as 1.96× the sampling standard deviation for α (horizontal) or β (vertical) rates. The rightmost panel shows approximate sampling distributions for ESD between the corresponding IAV subset (for the full alignment, this can be interpreted as the variance of the posterior ESD distribution), and the full IAV alignment (red), sperm lysin (blue), and primate COXI (green).

