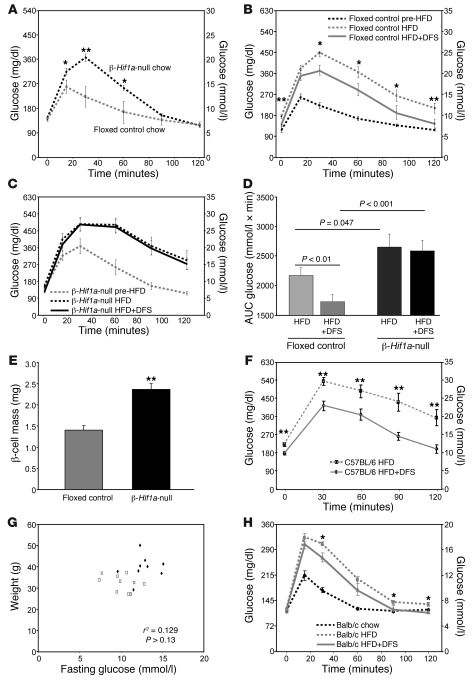
Figure 4. Lack of β cell HIF-1α leads to severe deterioration in glucose tolerance on a HFD and increasing HIF-1α levels with DFS improves glucose tolerance on a HFD.
(A) β-Hif1a-null mice (n = 10) had worse glucose tolerance than floxed control littermates (n = 17). (B) On HFD, glucose tolerance deteriorated in floxed controls and improved following DFS. (C) On HFD, glucose tolerance deteriorated markedly in β-Hif1a-null mice, and there was no improvement with DFS. (D) Glucose tolerance AUC for mice at completion of the HFD and HFD plus DFS stages. (E) β cell mass was increased in β-Hif1a-null mice at study completion. (F) Glucose tolerance was significantly better in C57BL/6 mice receiving HFD plus DFS versus mice receiving HFD alone (n = 10 per group). (G) Weight and fasting glucose were not significantly correlated in the mice. Rectangles indicate mice receiving HFD plus DFS, and triangles indicate mice receiving HFD alone. (H) Balb/c mice had deterioration in glucose tolerance on HFD (dotted line) compared with chow (dashed line). Their glucose tolerance improved significantly on HFD plus DFS (n = 12). *P < 0.05 and **P < 0.01.

