Figure 1.
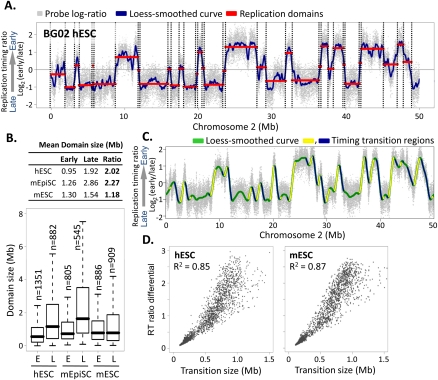
Structure and conservation of replication domains in hESCs. (A) Replication timing profile across a 50-Mb segment of human chromosome 2. Data shown are the average of two replicate hybridizations (dye-swap) for hESC line BG02. DNA synthesized early vs. late during S phase was hybridized to an oligonucleotide microarray, and the log2 ratio of early/late signal for each probe (probe spacing 1.1 kb) across the genome was plotted on the y-axis vs. map position on the x-axis. (Gray dots) Raw data. (Blue line) Loess-smoothed data. Replication domains (red lines) and boundaries (dotted lines) were identified by circular binary segmentation (Venkatraman and Olshen 2007). (B) Table (top) and box plots (bottom) of the sizes of early (RT > 0) vs. late (RT < 0) replication domains in hESCs (BG02), mESCs (D3), and mEpiSCs, with the ratio of late to early domain sizes. Horizontal bars for each box plot represent the 10th, 25th, 50th (median), 75th, and 90th percentiles. (C) Identification of timing transition regions (TTRs; blue and yellow highlight alternating TTRs) from loess-smoothed RT profiles. (Green) BG02 hESC. (D) Analysis of replication timing differential vs. physical distance for TTRs >100 kb in BG02 hESCs and D3 mESCs.

