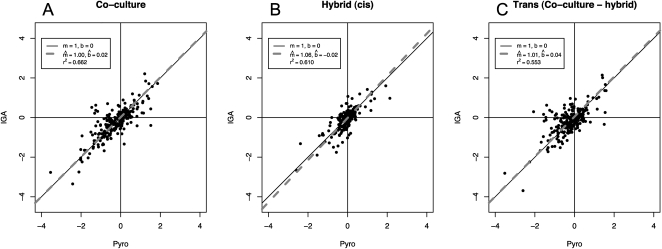
Figure 1.
Comparison of two methods of estimating ASE polymorphism. (A–C) Y-axis, log2(eIGA) (IGA transcriptome data), versus x-axis, log2(ePyro) (pyrosequencing). (A,B) comparison of co-culture and hybrid results from the two methods, respectively; (C) comparison between IGA sequencing and pyrosequencing for the value log2(eCo) − log2(eHy), which is also log2(etrans). To test if the regressions differ from equality, we tested the estimated regression coefficients against the null hypothesis H0: m = 1; b = 0. All P-values for these hypothesis tests for all regression parameters are not significant (all P-values > 0.05), indicating that IGA and pyrosequencing give very similar results.

