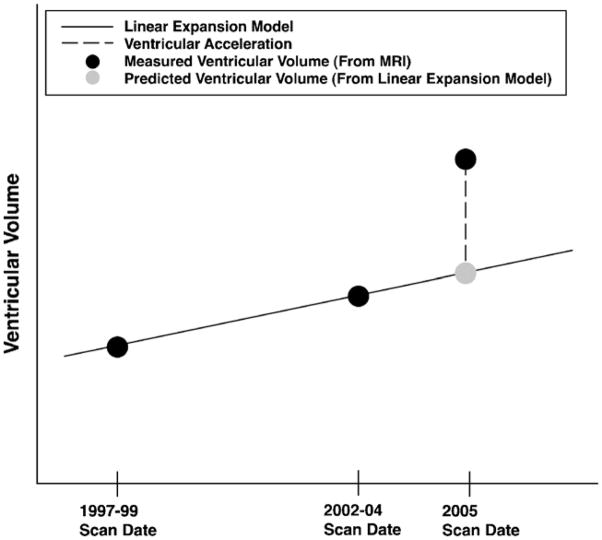
Fig. 1.
Schematic description of ventricular acceleration. Ventricular volumes are measured from MRI in 1997–1999, 2002–2004, and 2005 for all subjects (black dots). A linear expansion model of ventricular volume over time is established based on the 1997–1999 and 2002–2004 ventricular volumes (solid line). The linear expansion model is extrapolated to the 2005 scan date to give a predicted 2005 ventricular volume, based on an assumption of linear ventricular expansion (grey dot). The percentage difference between the predicted and measured 2005 ventricular volumes is referred to as the ventricular acceleration (dashed line).

