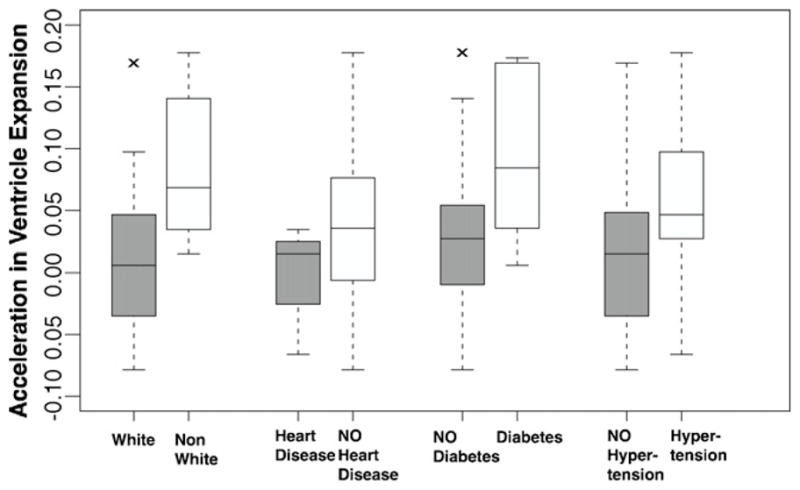
Fig. 2.

Box plots of ventricular expansion acceleration by race and cardiovascular risk factors. Boxes show the median and first and third quartiles; whiskers extend to the most extreme data point which is no more than 1.5 times the interquartile range from the box. Raw values of ventricular acceleration are shown, with no adjustment for terms from the multivariate statistical model.
