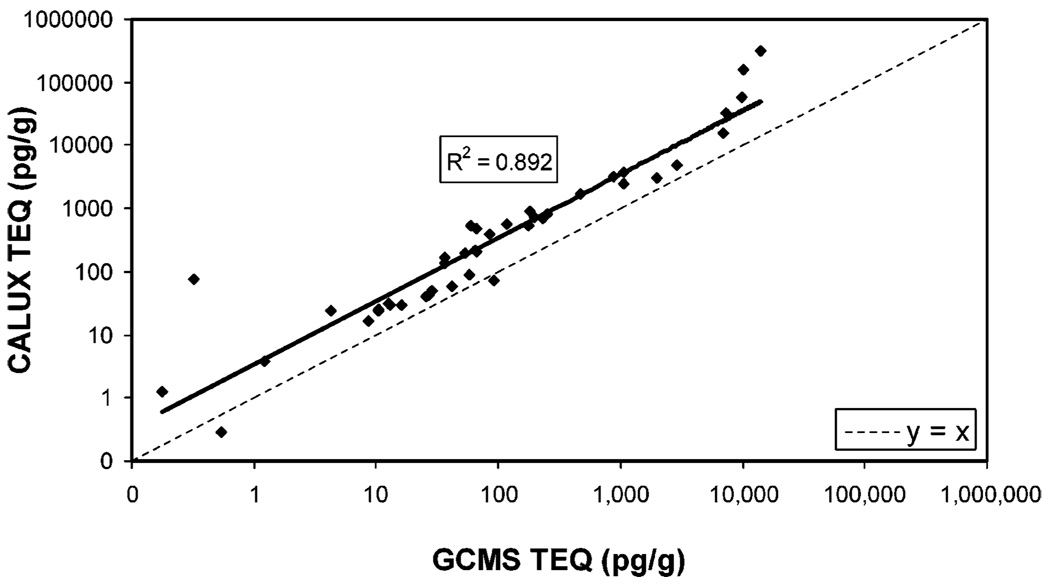
FIGURE 1.
Comparison of GC/MS-TEQ and CALUX-TEQ for SITE samples. TEQ was determined by GC/MS, CALUX-TEQ was determined by XDS-CALUX as described, and the average results for each quadruplicate analysis of 42 soil and sediment samples are graphed. Solid line is the data trend line; for comparison, the dashed line represents y = x(slope = 1 and intercept = 0). The regression line equation for the data is y = 3.356x1.0067.

