
Figure 7.
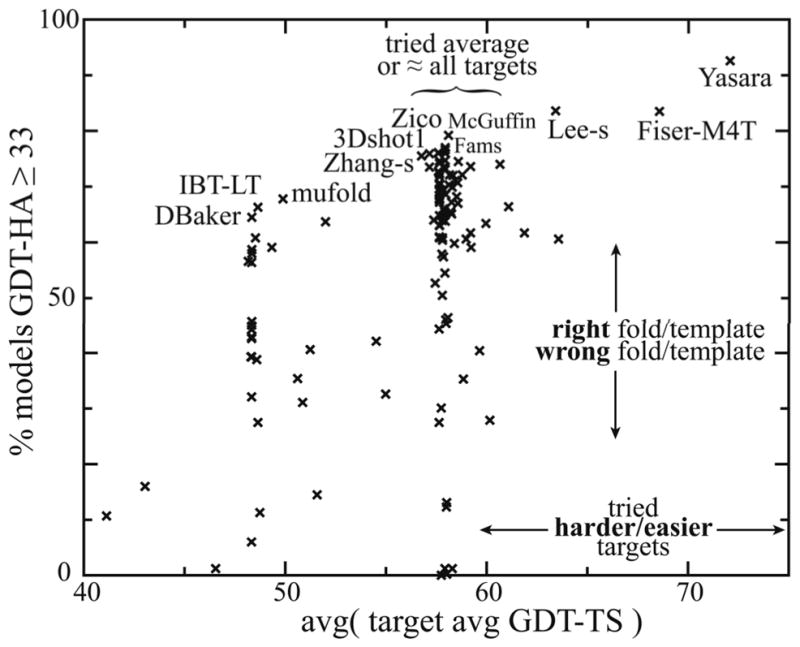
Percentage of models with roughly the “right fold”, plotted vs. difficulty of targets attempted. The percentage of all of a group’s models with GDT-HA≥ 33 (“right fold”) is on the y-axis. The average across a group’s attempted targets of all-model, all-group average GDT-TS (a measure of target difficulty) is on the x-axis. All groups attempting at least 20 targets are included. Names of several groups along the “outstanding edge” are labeled.