
Figure 2. Conditional β-cell lineage tracing.
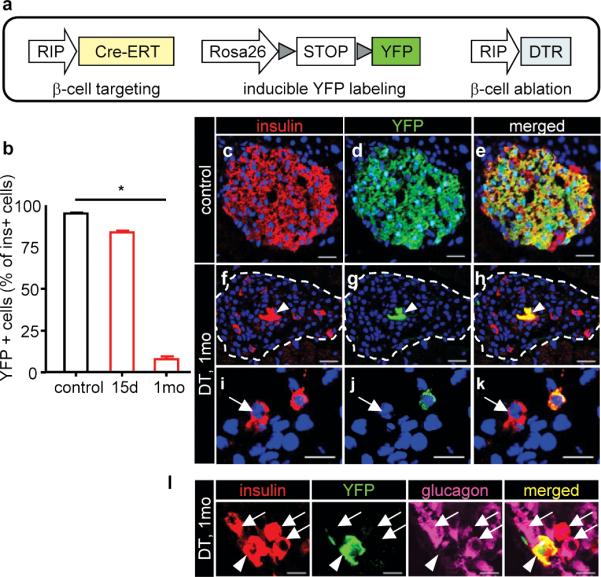
a, Transgenes. b, Proportion of YFP+ β-cells. Controls: 95.4±0.5% (n=4; 159-499 β-cells scored/mouse; 5-12 islets/individual). Two weeks and 1 month after DT, 80.6±2.9% and 7.6±1.8% β-cells were labeled, respectively (15 days: n=3 mice, 80-174 β-cells from 15-25 islets/mouse; 1 month: n=3 mice, 54-73 β-cells from 15-24 islets/mouse). *P<0.01. One-way ANOVA (p=0.0181) and Dunn's multiple comparison test (* p<0.05). c-e, Most β-cells express YFP in controls. f-k, Few β-cells are YFP+ after one month (arrowhead) (f-h). In i-k, 2 β-cells are shown (arrow: YFP-negative β-cell). l, glucagon+/insulin+ cells are YFP-negative (arrows); YFP+/insulin+ cells are glucagon-negative (arrowhead). Bars: 20 μm (c-h); 10μm (i-l).