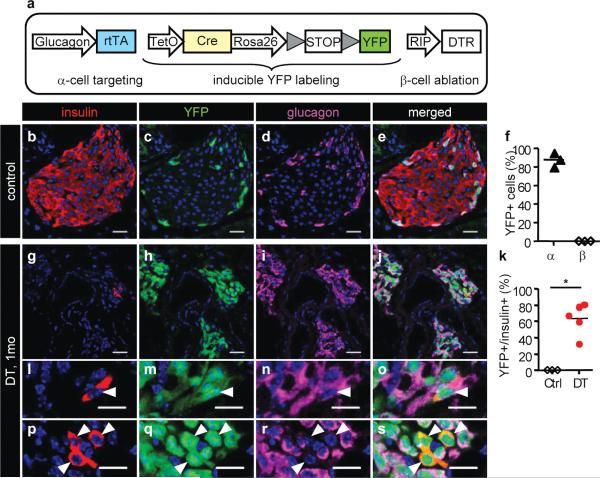
Figure 3. α-to-β reprogramming.
a, Transgenes used for the conditional α-cell lineage tracing. b-e, DOX-treated mice, without DT. f, Most α-cells are YFP+ in controls (88.1±4.42%; n=3 mice; 2,258 α-cells scored, 108 islets). g-j, One month after DT, islets are mostly composed of YFP+ α-cells. k, Proportion of YFP+/insulin+ cells in DOX-treated mice. DT-treated group: 63.6±8.6% (511 β-cells from 239 islets; 5 mice). l-o, YFP+/insulin+/glucagon+ cell (arrowhead; 89.87±3.04% of insulin+ cells). p-s, YFP+/insulin+ cells, not expressing glucagon (arrowheads). Bars: 20 μm (b-j); 10 μm (l-s).

