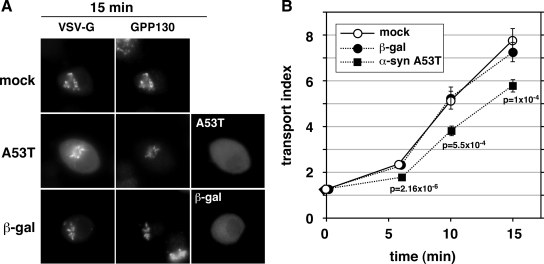
Figure 7.
α-Synuclein expression retards ER-to-Golgi transport in neuroendocrine PC12 cells. (A) Representative epifluorescent images from 15 min at 32°C, displaying VSV-G-GFP, GPP130, and either α-synuclein A53T or β-gal driven by pcDNA3.1 transfection. (B) Quantitation of transport employing at least 20 randomly chosen cells from each condition (see Materials and Methods). Bars represent SEs and are shown only when exceeding symbol size. The statistical significance of differences between the A53T and mock transport indices at the indicated time points are reported as p values from a two-tailed Student‘s t test.

