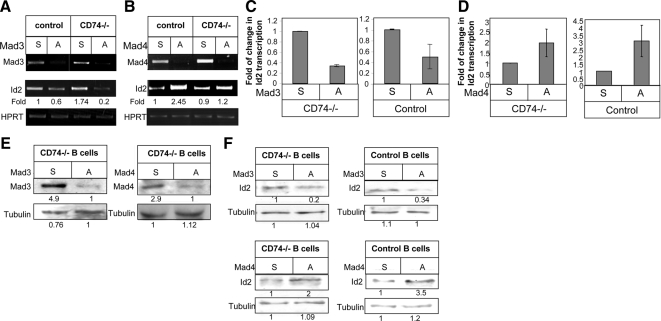
Figure 6.
Knockdown of Mad3/Mad4 expression in immature and mature cells using antisense oligos. Purified B cells derived from CD74−/− or control mice were incubated in the presence of 10 nM Mad3 (A) or Mad4 (B) antisense (A) or sense (S) oligonucleotides for 24 h at 37°C. Id2 transcription levels were analyzed using RT-PCR. Results presented are representative of at least seven independent experiments. (C and D) Quantitative RT-PCR results are expressed as a fold change in Id2 expression after treatment with antisense Mad3 (C) or Mad4 (D). Results presented are representative of at least three independent experiments. (E and F) Western blot showing levels of Mad3 or Mad4 (E) or Id2 (F) in S- or A-treated B cells from control and CD74−/− mice.

