Figure 1.
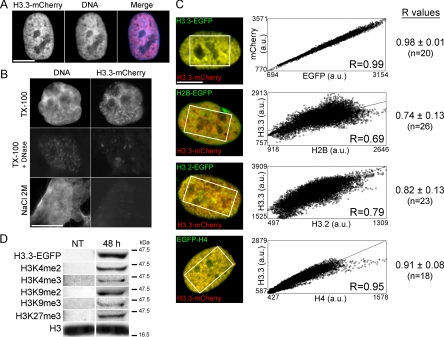
Incorporation of epitope-tagged H3.3 into chromatin in human primary cells. (A) Intranuclear distribution of H3.3-mCherry 168 h after transient transfection. DNA was labeled with DAPI. (B) Cells expressing H3.3-EGFP were extracted with 0.1% Triton X-100, 0.1% Triton X-100 and 1 mg/ml DNase I, or 2 M NaCl before fixation and DAPI staining. (C) Correlation analysis of colocalization of H3.3-mCherry with H3.3-EGFP, H2B-EGFP, H3.2-EGFP, and EGFP-H4. Scatter plots show for each cell illustrated on the left, pixel distribution whereby the intensity of a given pixel in the green image corresponds to the x-coordinate, and the intensity of the corresponding pixel in the red image is shown as the y-coordinate. Correlation was done in the area delineated on the images. Correlation coefficients (R) of overlaps between H3.3-mCherry and H3.3-EGFP, H2B-EGFP, H3.2-EGFP or EGFP-H4 are also shown for all cells (n, number of cells analyzed). (D) Western blot analysis of indicated posttranslational modifications on overexpressed H3.3-EGFP in HeLa cells. NT, nontransfected cells; 48 h, H3.3-EGFP-expressing cells 48 h posttransfection. Endogenous H3 was probed as a loading control (see Supplemental Figure S1).

