Figure 4.
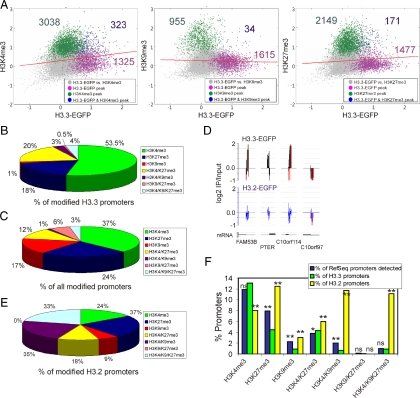
H3.3-EGFP associates with promoters enriched in H3K4me3 but not H3K9me3. (A) Two-dimensional scatter plots of MaxTen values for log2 IP/Input ratios for H3.3-EGFP versus H3K4me3 (left), H3K9me3 (middle), and H3K27me3 (right). MaxTen values are the average of both ChIP-on-chip replicates for each condition. Data points were colored to indicate classification according to peak calling, to show promoters enriched in H3.3-EGFP (purple); H3K4me3, H3K9me3, or H3K27me3 (green); or H3.3-EGFP together with either modification (blue). Red bars show regression lines for all points. (B) Proportions of modified H3.3-EGFP promoters enriched in indicated histone modifications. (C) Proportions of all modified RefSeq promoters enriched in indicated histone modifications. (D) Representative profiles of H3.3-EGFP and H3.2-EGFP occupancy on selected promoters on chromosome 10; red bars reflect out-of-scale signals. (E) Proportions of modified H3.2-EGFP promoters enriched in indicated histone modifications. (F) Percentages of promoters enriched in indicated histone modification (x-axis) expressed as a percentage of all RefSeq promoters on the array (blue bars), as a percentage of H3.3 promoters (green bars), and as a percentage of H3.2 promoters (yellow bars). **p < 10−4 and *p < 0.05 relative to the percentage of RefSeq promoters; chi-square test with Yates' correction; ns, nonsignificant.

