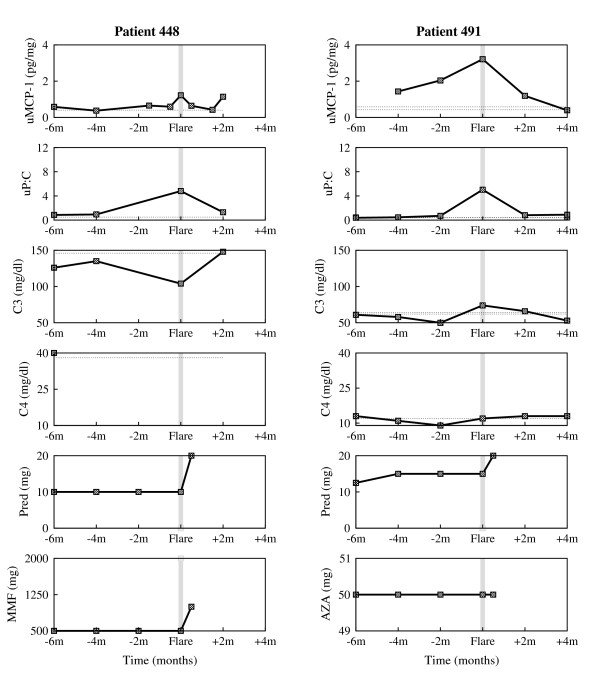
Figure 2.
Experimental data of individual patients enrolled in the Ohio SLE Study (II). Clinical measurements of urine MCP-1, urine P:C, serum C3 and serum C4 taken every 2 months, and accompanying therapy (Prednisone (Pred) = corticosteroids, Mycophenolate Mofetil (MMF), Azathioprine (AZA) = immunosuppressants) around 6 months before flare and 4 months after flare, for patient 448 (first column) and patient 491 (second column). The horizontal dotted lines represent baseline values determined at two different time points that were at least 6 months from any flare activity. The gray vertical line marks the renal flare.

