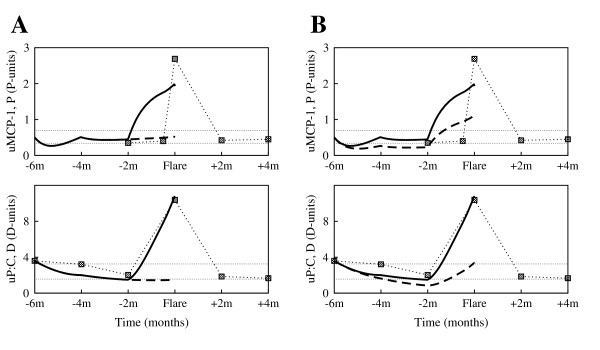
Figure 7.
Before flare interventions: simulations for patient 444. (A) No drop in the anti-inflammatory therapy 2 months before flare would keep pro-inflammation and damage low; sa = 2 A-units/day, 2 months before flare (solid curves); sa = 4 A-units/day, 2 months before flare (dashed curves). (B) Therapeutic strategies aimed at restricting immune complex infiltration into the kidneys and the production of more immune complexes as a result of debris accumulation, could also improve disease symptoms; si = 6 I-units/days, and sid = 1 I-units/days (solid curves); si = 3 I-units/days, and sid = 0.5 I-units/days (dashed curves). All other parameters are as listed in Table 1 and Table 2.

