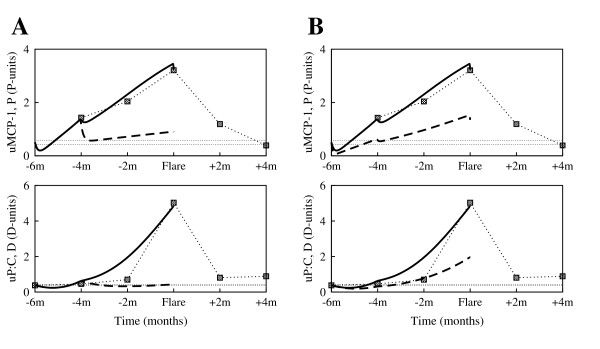
Figure 9.
Before flare interventions: simulations for patient 491. (A) A larger increase of the corticosteroid dose 4 months before flare would control the inflammation and avoid clinical manifestations of the renal flare; sa = 1.2 A-units/day 4 months before flare (solid curves); sa = 2 A-units/day 4 months before flare (dashed curves). (B) The initial anti-inflammatory therapy would have better results if methods to lower the half-life of the pro-inflammatory mediators, μp, could also be implemented; μp = 0.33/day (solid curves), and μp = 0.66/day (dashed curves). All other parameters are as listed in Table 1 and Table 2.

