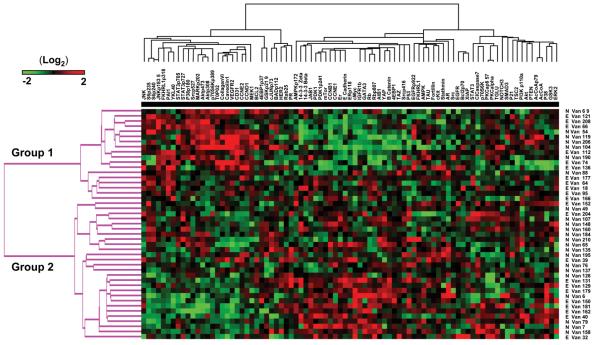
Figure 2.
Heat map of unsupervised cluster analysis of proteins and samples by RPPA. Proteins tested by RPPA are listed across the top of the heat map while the patient samples are listed down the right side. An E preceding the sample name indicates an elevated Ca-125 by 3rd cycle of chemotherapy whereas a preceding N indicates a Ca-125 normalization. Cluster trees of patient groups and proteins are shown on the left and top of the heat map respectively. Red indicates increased protein expression while green is low relative to the other samples.

