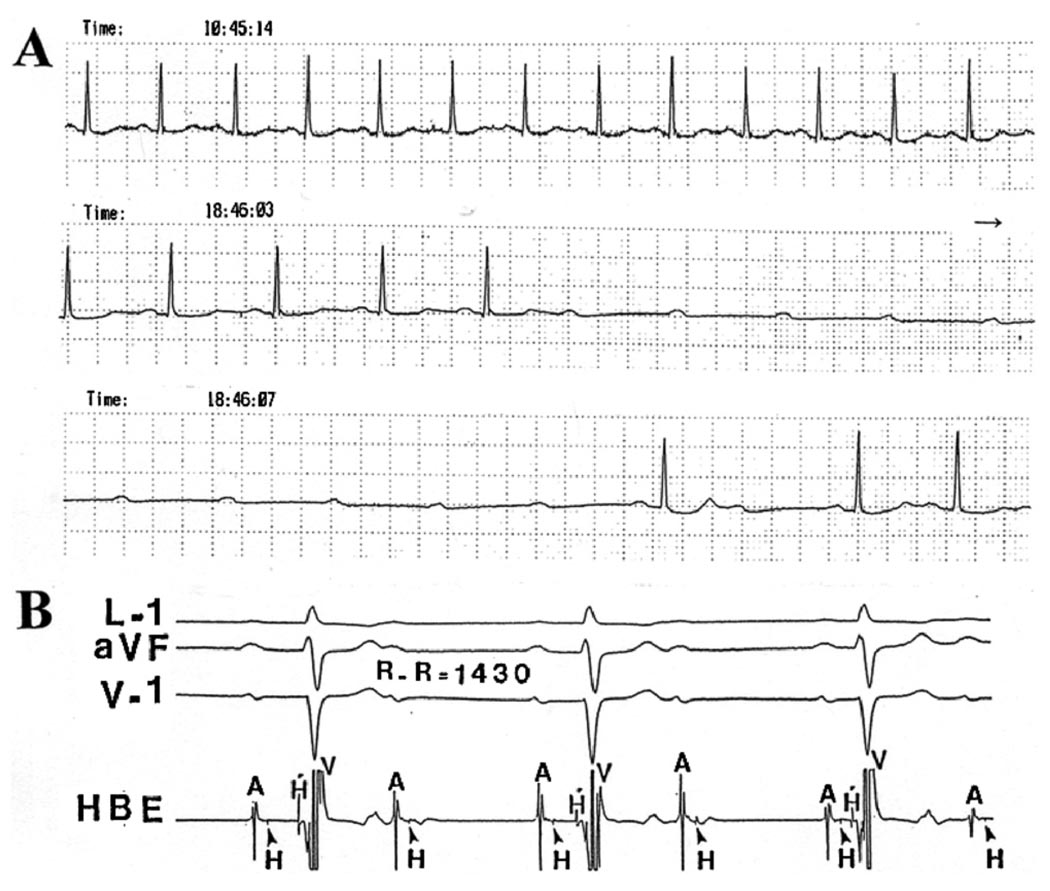
Figure 2.
Recordings from a 73-year-old woman with recurrent syncope. A: Selected recordings from a Holter ECG. The second and third strips are continuous recordings of lead I showing the development of PAVB with no apparent change in the atrial rate. Several such episodes developed during the 24-hour recording, while 1:1 AV conduction could be seen at other times at a faster atrial rate (top rhythm strip). B: Conduction system study obtained a week later when the patient presented with a stable 2:1 AVB. The recording shows a split His potential (H and H’) and intra-Hisian block on the His bundle electrogram (HBE). Notice the normal QRS duration.

