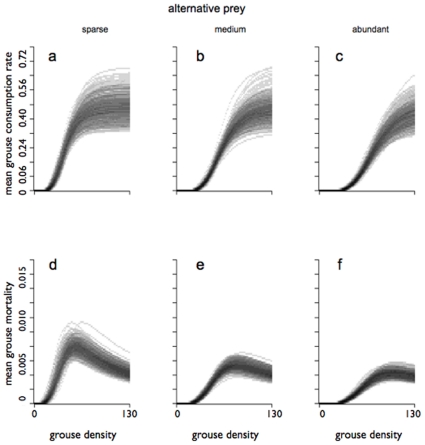
Figure 1. Estimated consumption rate and mortality rate for grouse chicks, as a function of grouse density.
Estimated mean consumption is shown in the top row (a,b,c) and per capita mortality is shown in the bottom row (d,e,f), at various densities of alternative prey. Per capita grouse chick mortality was calculated as (hourly consumption rate)/(grouse chick density). The grey shades represent the posterior probability density at each point. In the left-hand column (a,d), both meadow pipits and field voles are at low densities (2 pipits counted per km of transect, and 0.1 voles caught per 100 trap nights, htn−1) , whereas in the right-hand column (c,f), both pipits and voles are abundant (20 pipits.km−1, 4 voles.htn−1). The middle column (b,e) represents an intermediate case (9 pipits.km−1; 1 vole.htn−1).

