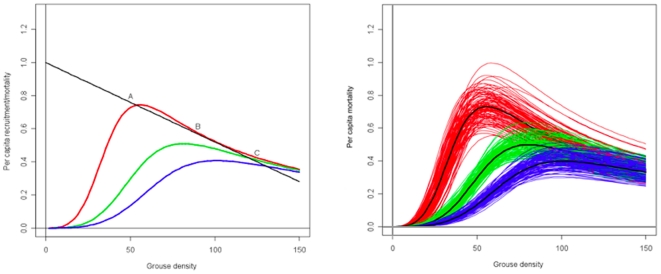
Figure 2. Relationship between the density of grouse chicks, per capita grouse recruitment and per capita chick mortality induced by a population of hen harriers.
(a)Harriers were assumed to be present at a density of 0.16 pairs.km−2 (which is typical for the study sites [32]). The equilibrium density for the grouse population in the absence of harriers is assumed to be 208 chicks.km−2 [35]. Mortality curves are shown for the same three densities of alternative prey as those in Fig. 1 (red = low, green = intermediate, blue = high). Equilibria occur where the mortality curves and the recruitment line intersect. Equilibria A and C are stable, equilibrium B is unstable. (b)Uncertainty in the relationship between harrier-induced chick mortality and chick density. Each curve shows the mortality for one set of parameter values drawn at random from the joint posterior distribution for the MSFR model, thus taking account of any correlation among the parameters.

