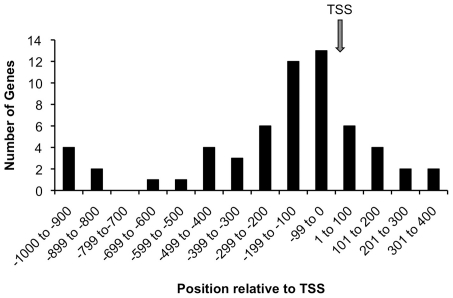
Figure 4. CaRF ChIP-Seq peaks are enriched near transcription start sites.
The ChIP peaks from Table S4 were viewed in the UCSC genome browser (http://genome.ucsc.org) and the distance from the center of each peak to the nearest annotated transcription start site (TSS) was calculated. For the 60 peaks within 1kB of a TSS we tallied the number within each 100bp. The arrow shows the position of the TSS.

