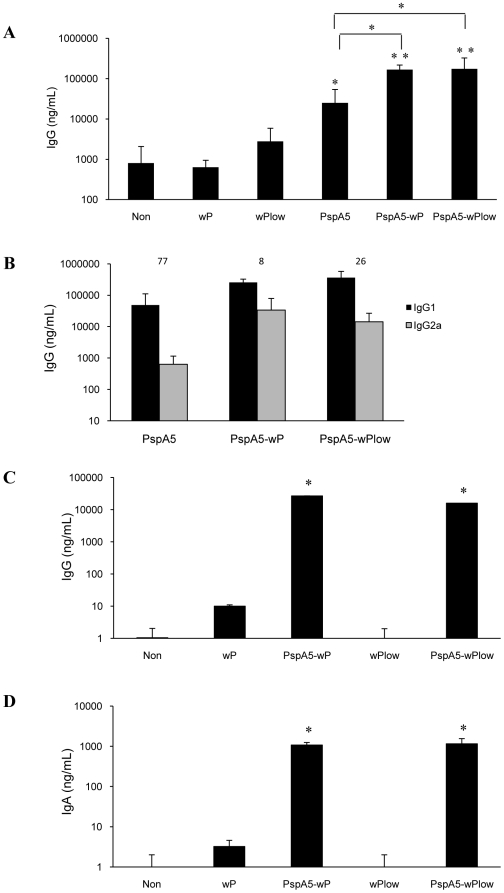
Figure 2. Evaluation of anti-PspA5 antibodies in mice immunized with the different vaccine formulations.
Three weeks after the last immunization anti-PspA5 IgG (A), IgG1 and IgG2a (B) in the sera and IgG (C) and IgA (D) in BALF were detected through ELISA. Concentration of antibodies (mean of 6 animals for A and B and 4 animals for C and D) are shown. IgG1∶IgG2a ratios are indicated above the bars (B). Results are representative of two experiments (A and B). Asterisks represent significant differences from control groups or from group immunized with PspA5, when indicated (* P<0.05; ** P<0.005, Mann-Whitney U test).

