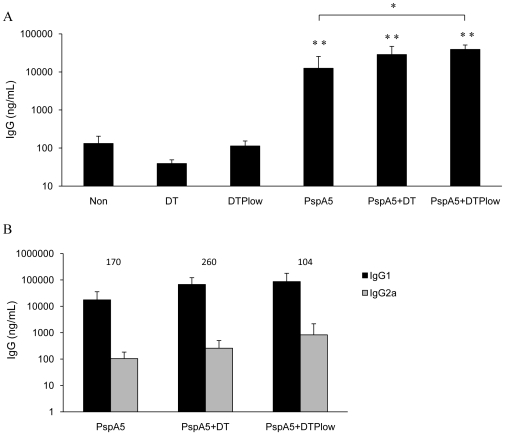
Figure 7. Evaluation of anti-PspA5 antibodies in mice immunized with the different vaccine formulations.
Three weeks after the last immunization anti-PspA5 IgG (A), IgG1 and IgG2a (B) in the sera were detected through ELISA. Concentration of antibodies (mean of 6 animals) is shown. IgG1∶IgG2a ratios are indicated above the bars (B). Results are representative of two experiments. Asterisks represent significant differences from indicated groups (**P<0.005, when compared with non-immunized mice or with the respective control groups and *P<0.01, when compared with mice immunized with PspA5, Mann-Whitney U test).

