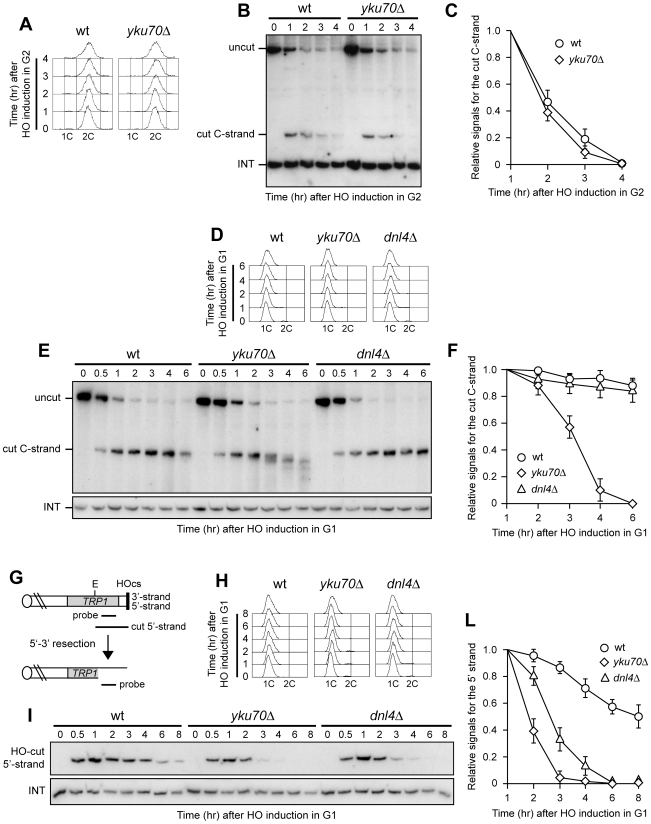
Figure 3. Yku inhibits resection at a de novo telomere specifically in G1.
(A–C) HO expression was induced at time zero by galactose addition to nocodazole-arrested wild type (YLL2599) and otherwise isogenic yku70Δ cell cultures that were then kept arrested in G2. (A) FACS analysis of DNA content. (B) RsaI- and EcoRV-digested genomic DNA was hybridized with probe A as described in Figure 1C. (C) Densitometric analysis. Plotted values are the mean value ±SD from three independent experiments as in (B). (D–F) HO expression was induced at time zero by galactose addition to α-factor-arrested wild type (YLL2599) and otherwise isogenic yku70Δ and dnl4Δ cell cultures that were then kept arrested in G1. (D) FACS analysis of DNA content. (E) RsaI-digested genomic DNA was hybridized with the single-stranded riboprobe A described in Figure 1A, which anneals to the 5′ C-strand and reveals an uncut 460 nt DNA fragment (uncut). After HO cleavage, this fragment is converted into a 304 nt fragment (cut) detected by the same probe (cut C-strand). (F) Densitometric analysis. Plotted values are the mean value ±SD from three independent experiments as in (E). (G) The system used to generate an HO-induced DSB. Hybridization of EcoRV-digested genomic DNA with a probe that anneals to the 5′ strand to a site located 215 nt from the HO cutting site reveals a 430 nt HO-cut 5′-strand fragment. Loss of the 5′ strand beyond the hybridization region leads to disappearance of the signal generated by the probe. (H–L) HO expression was induced at time zero by galactose addition to α-factor-arrested wild type (YLL2600) and otherwise isogenic yku70Δ and dnl4Δ cells, all carrying the system in (G). Cells were then kept arrested in G1. (H) FACS analysis of DNA content. (I) EcoRV-digested genomic DNA was hybridized with the probe indicated in (G). The INT band, corresponding to a chromosome IV sequence, serves as internal loading control. (L) Densitometric analysis. Plotted values are the mean value ±SD from three independent experiments as in (I).

