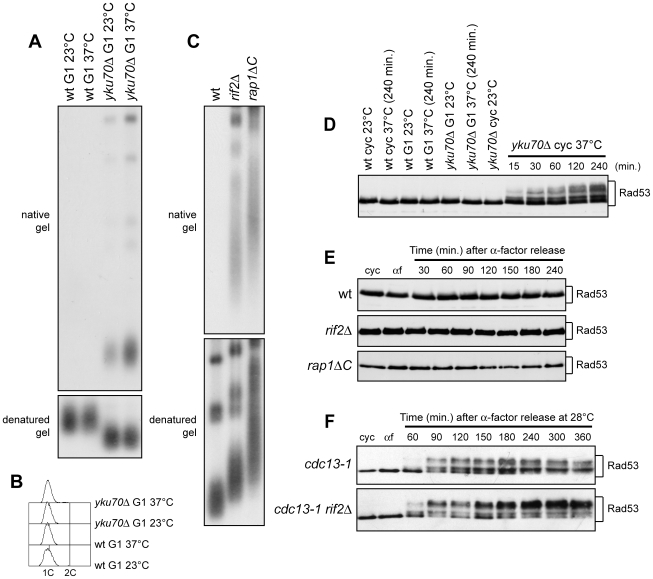
Figure 5. Analysis of single-stranded overhangs at native telomeres.
(A,B) G1-arrested (G1) wild type (YLL2599) and otherwise isogenic yku70Δ cell cultures were incubated at either 23°C or 37°C for 4 hours in the presence of α-factor. (A) Genomic DNA was digested with XhoI and single-stranded telomere overhangs were visualized by in-gel hybridization (native gel) using an end-labeled C-rich oligonucleotide [31]. The same DNA samples were separated on a 0.8% agarose gel, denatured and hybridized with the end-labeled C-rich oligonucleotide for loading and telomere length control (denatured gel). (B) FACS analysis of DNA content. (C) Genomic DNA prepared from wild type (YLL2599) and otherwise isogenic rif2Δ and rap1ΔC cell cultures, exponentially growing at 25°C, was digested with XhoI and the single-stranded telomere overhangs were visualized by in-gel hybridization as in (A). (D) Wild type (YLL2599) and otherwise isogenic yku70Δ cell cultures exponentially growing (cyc) at 23°C were incubated at 37°C for the indicated time points. G1-arrested wild type and yku70Δ cells (G1) were incubated at either 23°C or 37°C for 4 hours. Rad53 was visualized at the indicated times by western analysis with anti-Rad53 antibodies. (E) α-factor arrested wild type (YLL2599) and otherwise isogenic rif2Δ and rap1ΔC cell cultures were released into the cell cycle at 25°C. Rad53 was visualized as in (D). (F) α-factor-arrested cdc13-1 and cdc13-1 rif2Δ cells were released into the cell cycle at 28°C. Rad53 was visualized as in (D).

