Figure 1.
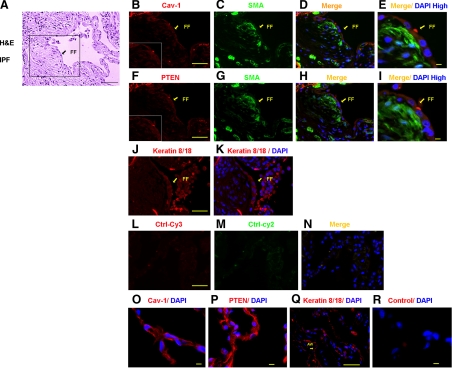
Myofibroblasts within IPF fibroblastic foci display low-intensity expression of both caveolin-1 and PTEN protein. H&E and immunofluorescent confocal microscopic analysis were performed on control human lung tissue (n = 4) and IPF tissue (n = 3). Shown is representative H&E staining of a fibroblastic foci (FF) in IPF tissue (A). Immunofluorescent confocal microscopic analysis was performed on the IPF fibroblastic foci within the boxed region shown in A and illustrates the pattern of caveolin-1 (Cav-1), PTEN, α-smooth muscle actin (α-SMA), and keratin 8/18 expression (B–K). Insets in B and F display the pattern of caveolin-1 and PTEN staining in myofibroblasts within the fibroblastic focus in a zone beneath the epithelium and in the overlying epithelium, respectively. Myofibroblasts are identified by α-smooth muscle actin staining, epithelial cells by keratin staining, and nuclei are identified by DAPI staining. Please note that “Merge” indicates merging of caveolin-1 (red) with α-SMA (green) or PTEN (red) with α-SMA (green). L–N: Controls performed on IPF lung tissue consisting of secondary antibody without primary (Ctrl-Cy3, Ctrl-Cy2). O–R: Immunostaining of control lung tissue demonstrating prominent caveolin-1 and PTEN staining in cells lining the alveolar airspace. Scale bar = 50 μm.

