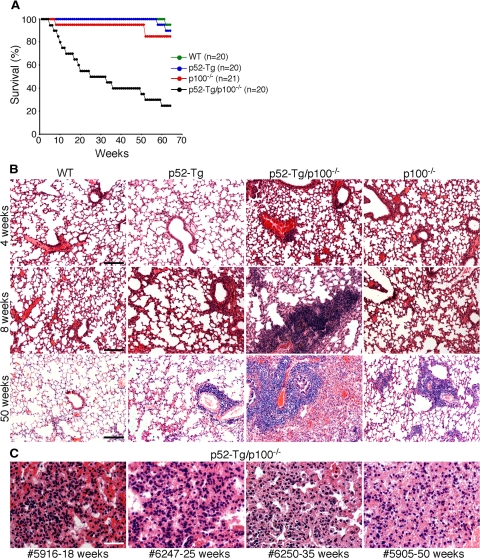
Figure 2.
Development of fatal lung inflammation in p52-Tg/p100−/− mice. A: Survival curve of p52-Tg/p100−/− mice and their wild-type (WT), p52-Tg, and p100−/− littermates. Numbers of mice for each group are indicated. B: H&E staining of formalin-fixed lung sections from wild-type, p52-Tg, p52-Tg/p100−/−, and p100−/− littermates at the indicated ages. Scale bars = 400 μm. C: H&E staining of formalin-fixed lung sections from representative moribund p52-Tg/p100−/− mice at the indicated ages. Scale bar = 100 μm.

