Figure 4.
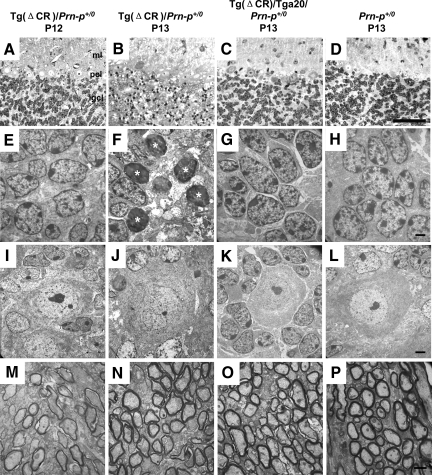
Rapid appearance of degenerating CGNs between P12 and P13 in Tg(ΔCR)/Prn-p+/0 mice. Cerebellar sections were prepared from Tg(ΔCR)/Prn-p+/0 mice at P12 (A, E, I, and M) and P13 (B, F, J, and N); and from Tg(ΔCR)/Tga20/Prn-p+/0 (C, G, K, and O) and Prn-p+/0 mice (D, H, L, and P) at P13. A–D: Semithin plastic sections from each sample group were stained with methylene blue/azure II and evaluated by light microscopy. The molecular layer (ml), Purkinje cell layer (pcl), and internal granule cell layer (igcl) are indicated in A. Large numbers of pyknotic granule cells appear in the internal granule cell layer of Tg(ΔCR)/Prn-p+/0 mice at P13 (B), corresponding to the onset of clinical illness.8 E–P: Electron microscopic images of cerebellar architecture in Tg(ΔCR) mice. Representative images of the internal granule cell layer (E–H), Purkinje cell layer (I–L), and cerebellar white matter (M–P) are shown. Asterisks in F indicate degenerating CGNs. Scale bars: 250 μm (A–D); 1.7 μm (E–H); 2.5 μm (I–L); and 1.1 μm (M–P).

