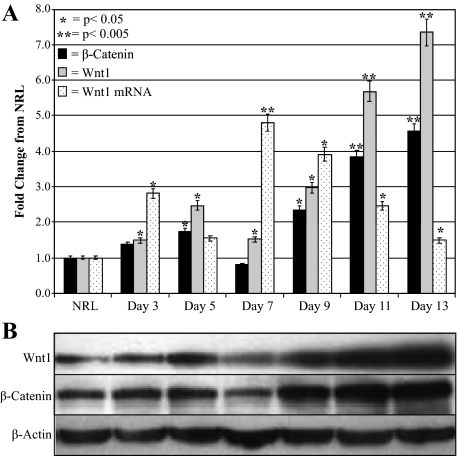
Figure 2.
Changes in Wnt1 and β-catenin levels during oval cell induction. A: Densitometric analysis of β-catenin and Wnt1 Western Blots and real-time PCR analysis of Wnt1 mRNA levels during oval cell induction. B: Western blots of β-catenin and Wnt1 during oval cell activation. All densitometric data were normalized to β-actin levels and compared with NRL. Wnt1 mRNA expression increases before the peak in oval cell production (Day nine). Significant message level differences occur during oval cell induction as compared with NRL. Western blots of oval cell induction demonstrate β-catenin and Wnt1 levels increase dramatically after seven days, which is the peak in Wnt1 message expression.

