Figure 3.
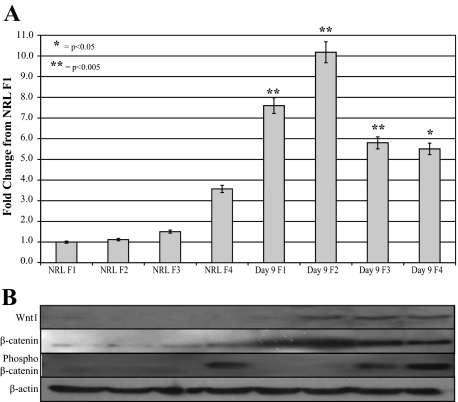
β-catenin levels of liver cell fractions. Cells isolated from liver by Nycodenze density-based gradient were analyzed by Western blot for Wnt1, β-catenin, and phosphorylated (inactive) β-catenin. A: Densitometric analysis of β-catenin Western blot. All data were normalized to β-actin levels and compared with NRL F1. B: Western blot of cells isolated by perfusion from normal liver or Day 9 of the oval cell induction model. NRL cells fail to express Wnt1; however, after oval cell induction, cells within fractions two through four express Wnt1. β-catenin is considerably increased in cells isolated from Day nine liver, whereas inactive phosphorylated β-catenin levels are the same in the hepatocyte fraction, increase in the small hepatocyte fraction, and are almost absent from oval cells during oval cell induction.

