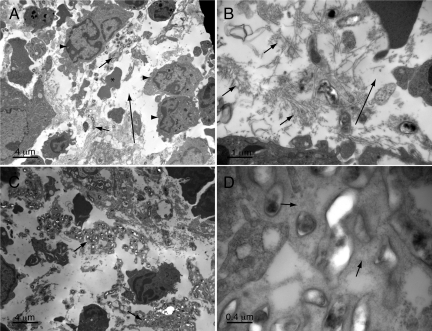
Figure 6.
Ultrastructural pathology of the spleen. A: Lower power image demonstrating myeloid infiltrate (arrowheads), bacteria (short arrows), red cells (asterisk), and edema (electron-lucent areas, long arrow). B: Higher power images showing bacteria surrounded by a relatively haphazard arrangement of collagen fibers (arrows) in comparison with liver lesions and edema (long arrow). C: Bacterial aggregates embedded in an osmophilic granular matrix (arrows). D: Higher power image of matrix (arrows) and embedded bacteria. Magnifications in A–D: ×1700, ×6,500, ×1,700, and ×17,100, respectively.

