Figure 1.
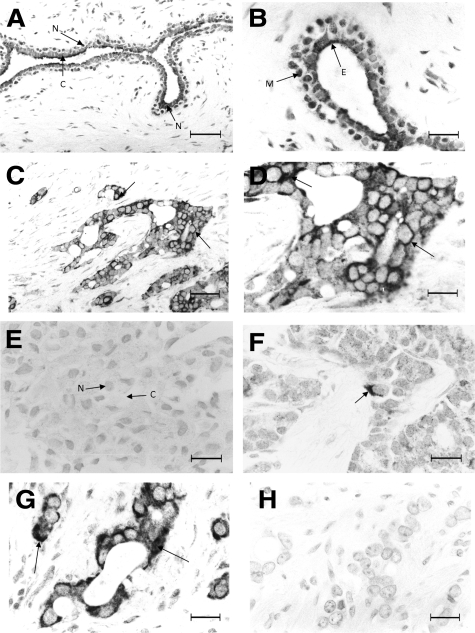
Immunocytochemical staining for FANCD2. A: Fibroadenoma showing strong (+++) nuclear staining (N) and moderate (++) cytoplasmic staining (C) of the tumor cells. B: Fibroadenoma at higher magnification showing stronger nuclear staining of the myoepithelial cells (M) than the surrounding epithelial cells (E) of the tumor. C and D: Invasive carcinoma showing strong (+++) cytoplasmic staining (arrows) of the carcinoma cells at lower (C) and higher (D) magnification. E: invasive carcinoma showing no nuclear (N) or cytoplasmic staining (C) of the carcinoma cells. F: invasive carcinoma showing borderline (1–5%) cytoplasmic staining (arrow) of the carcinoma cells. G and H: Serial sections of invasive carcinoma incubated with (G) anti-FANCD2 and (H) anti-FANCD2 pre-incubated with immunizing peptide showing (G) strong (+++) cytoplasmic staining (arrows) and (H) no staining (−), respectively. Magnification: ×220 A and C; ×550 B and D–H. Scale bar: 50 μm (A and C); 20 μm (B and D–H).

