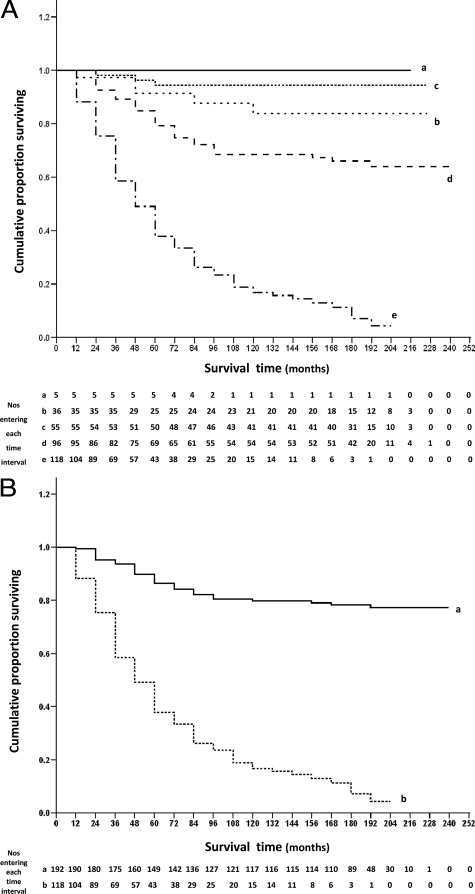
Figure 4.
Association of immunocytochemical staining of the primary carcinoma for cytoplasmic FANCD2 with overall survival of patients. A: The cumulative proportion of patients surviving as a fraction of the total at 12 monthly intervals after presentation for patients with carcinomas classified as follows: (a) +++, strong staining (——– ; 100% = 5 patients); (b) ++, moderate staining (------; 100% = 36 patients); (c) +, intermediate staining (........ ; 100% = 55 patients); (d) +/−, borderline staining (– – –); 100% = 96 patients) and (e) −, negative staining (- — - —, 100% = 118 patients) for FANCD2. There were 5 censored observations in a (4 dead of other causes (doc); cumulative proportion surviving (cps) = 100%; median survival time (mst) > 204 months); 31 in b (14 doc; cps = 84%; mst >216 months); 52 in c (13 doc; cps = 94%; mst >216 months); 65 in d (17 doc; cps = 64%; mst >228 months); and 15 in e (12 doc; cps = 4%; mst = 46.8 months). The cumulative proportions surviving ± 95% CIs were (a) 1.00 ± 0.0, (b) 0.91 ± 0.05, (c) 0.94 ± 0.03, (d) 0.75 ± 0.05, and (e) 0.33 ± 0.04, after 5 years; (a) 1.00 ± 0.0, (b) 0.84 ± 0.07, (c) 0.94 ± 0.03, (d) 0.69 ± 0.05, and (e) 0.16 ± 0.03, after 10 years; (a) 1.00 ± 0.0, (b) 0.84 ± 0.07, (c) 0.94 ± 0.03, (d) 0.64 ± 0.05, and (e) 0.04 ± 0.03, after 15 years; and (a) 1.00 ± 0.0, (b) 0.84 ± 0.07, (c) 0.94 ± 0.03, (d) 0.64 ± 0.05, and (e) 0.04 ± 0.03, after 20 years. The five curves were significantly different (Wilcoxon statistic χ2 = 125.83, 4 d.f., P < 0.0001), and significantly different in the successive pairwise combinations of c with d (χ2 = 13.85, 1 d.f., P < 0.0001) and d with e (χ2 = 53.29, 1 d.f., P < 0.0001) but not b with c (χ2 = 2.03, 1 d.f., P = 0.155) nor a with b (χ2 = 0.63, 1 d.f., P = 0.43). The malignant grade of the 5 strong staining carcinomas (+++) (a) was confirmed as grade I (2 patients), II (2 patients), and III (1 patient). B: The cumulative proportion of patients surviving as a fraction of the total at 12 month intervals after presentation with carcinomas classified as (a) positive staining using a 1% cut off (——– ; 100% = 192 patients) and (b) −, negative staining (----- ; 100% = 118 patients) for FANCD2. There were 153 censored observations in a (48 doc; cps = 77%; mst >228 months) and 15 in b (12 doc; cps = 4%; mst = 46.8 months). The cumulative proportions surviving ± 95% CIs were (a) 0.84 ± 0.03, (b) 0.33 ± 0.04, after 5 years; (a) 0.80 ± 0.03, (b) 0.16 ± 0.03, after 10 years; (a) 0.77 ± 0.03, (b) 0.04 ± 0.03, after 15 years; and (a) 0.77 ± 0.03, (b) 0.04 ± 0.03, after 20 years. The two lines were significantly different (Wilcoxon statistic χ2 = 117.14, 1 d.f., P < 0.0001).

