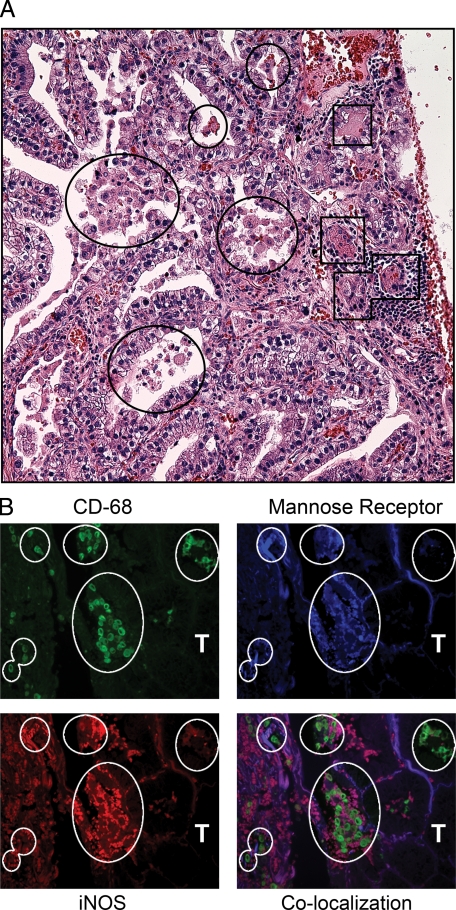
Figure 1.
Activation state of macrophages associated with human AC. A: H&E-stained human ACs have both TAMs (circles) and TIMs (squares). B: Immunofluorescent staining for macrophages (green, CD-68) expressing both mannose receptor (blue) and iNOS (red). White circles indicate corresponding areas of macrophage localization. T indicates tumor tissue. Magnification for H&E images is ×400 and ×630 for immunofluorescent staining.

