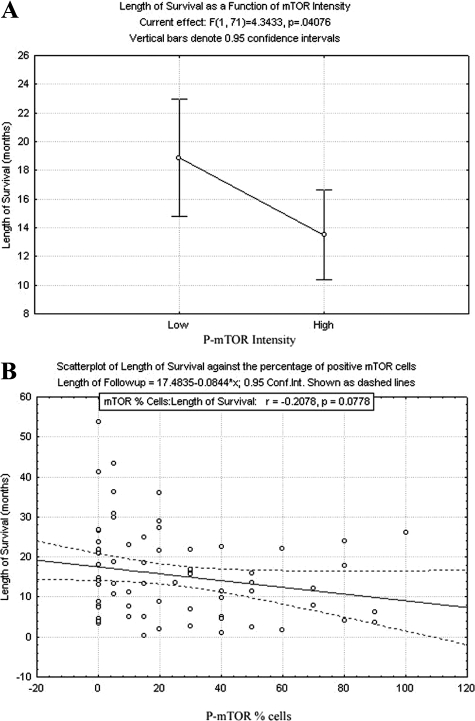
Figure 4.
Cox Proportional Hazards model analysis was performed for A, P-mTOR intensity (0 to 1+ versus 2 to 3+; exp(β) = 1.693, P = 0.041). B: Percentage of cells immunoreactive for P-mTOR as quartiles exp(β) = 1.007, P = 0.078). Both P-mTOR intensity and percentage of positive cells were associated with reduced disease-specific survival.

