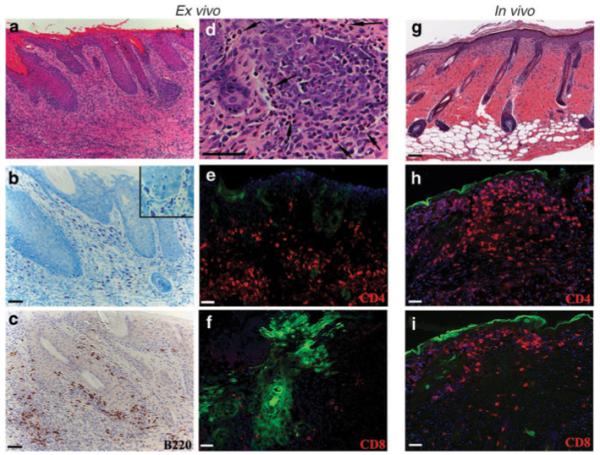
Figure 2. Cellular infiltrates in the ex vivo- and in vivo-transduced skin of mice.

(a–f) Histological analysis of skin reconstituted from ex vivo-transduced keratinocytes on FVB mice at 4 weeks post grafting (g–i) or that of in vivo-transduced skin at 2 weeks post-transduction. (a, d, g) Skin sections were stained with hematoxylin/eosin and showed pronounced dermal infiltration. (b) Skin sections were stained with toluidine blue to identify mast cells that appear red-purple in color. The image in d is at a higher magnification than that in showing numerous eosinophils (arrow) easily identified by their pluri-lobed nuclei and intense eosin staining of their cytoplasm. Sections were immunostained with antibodies recognizing B cells (B220), CD4+ cells (CD4), and cytotoxic T cells (CD8). (e, g, h, i)In sections stained by immunofluorescent, GFP-expressing cells are indicated by green and antibody staining in red. (h–i) GFP is about to be lost and expressed in the cornified layer in in vivo-transduced skin. Sections were counterstained with DAPI to visualize tissue structure and nuclei. Bar 100 μm for a, g; 50 μm for b–f, h, i.
