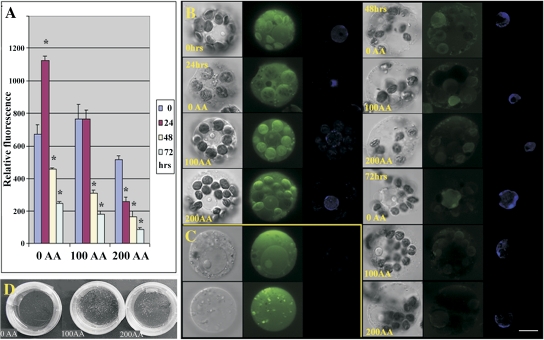
Fig. 1.
The ROS measurement and cellular localization. The subset (A) shows measurements of ROS during protoplast culture (72 h) in relation to AA treatments (0, 100, and 200 mg l−1). The values marked with an asterisk were significantly different from values obtained in freshly isolated protoplasts (P <0.05). The subset (B) shows not only the level of ROS in the cells, in relation to the time of culture and AA concentration, but also demonstrates the localization of ROS within cells. The highest intensity signals of the ROS (green) are visible in freshly isolated protoplasts and protoplasts at 24 h AI localized mostly in chloroplasts, cytoplasm, peroxisomes, and also in nuclei that were stained by Hoechst (blue). The subset (C) demonstrates a part of the protoplast populations in cultures without AA and 100 mg l−1 AA occurring between 24–48 h AI. These types of protoplasts are characterized by high ROS content and enlarged weakly stained nuclei or without nuclei. The subset (D) displays, separately, a proliferation for 2 week cultures of protoplast-derived cells, compared to the AA treatment. Application of AA led to the increasing amounts of microcalli. The scale bar=10 μm.

