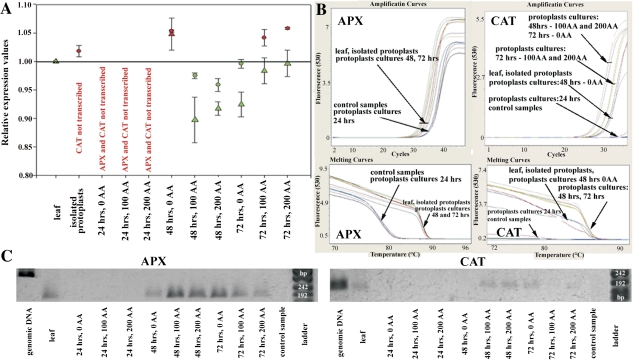
Fig. 2.
APX and CAT expression profile in protoplast cultures, treated and untreated with AA. The subset (A) demonstrates the relative quantification of the APX (circles) and CAT (triangles) transcription by RT-PCR for protoplasts, during their culture and AA application. The transcription level was related to the expression measured in the leaves. The circles and triangles (marked in red) demonstrate down-regulation of AP expression; the green ones up-regulation. The subset (B) shows amplification and melting curves from RT-PCR experiments and (C) shows the size of RT-PCR products of APX and CAT for leaves (L) and protoplasts at 72 h AI (P). The PCR products of APX and CAT using genomic DNA as a APX template displaying intron are also shown.

