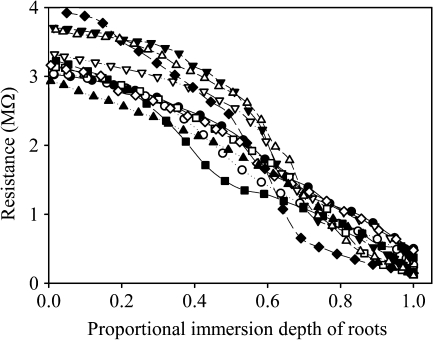
Fig. 2.
Ten examples (out of 31 samples in total) of the root electrical resistance as determined by gradual immersion of the root at different depths in the nutrient solution. The x-axis scale is normalized according to the immersion depth as recorder on the micrometer (see Fig. 1). Each curve represents a single root.

