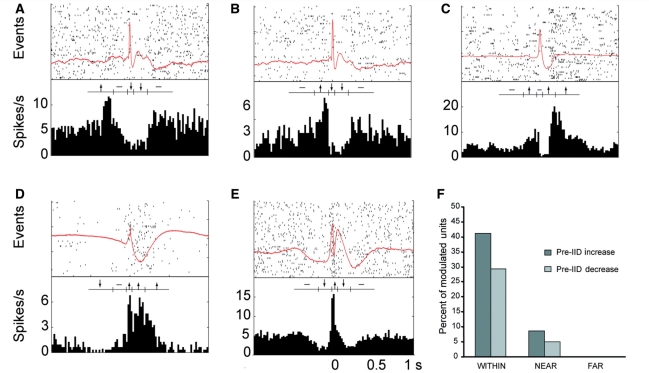
Figure 4.
Neuronal units whose firing changes preceded the interictal discharge (IID). Examples of units that (A) increase long before, (B) increase just before, (C) increase after, (D) decrease long before and (E) decrease just before the interictal discharge. (F) Histogram of percent of modulated units which show an increase or decrease before the interictal discharge in regions which were within, near or far from the seizure onset zone.

