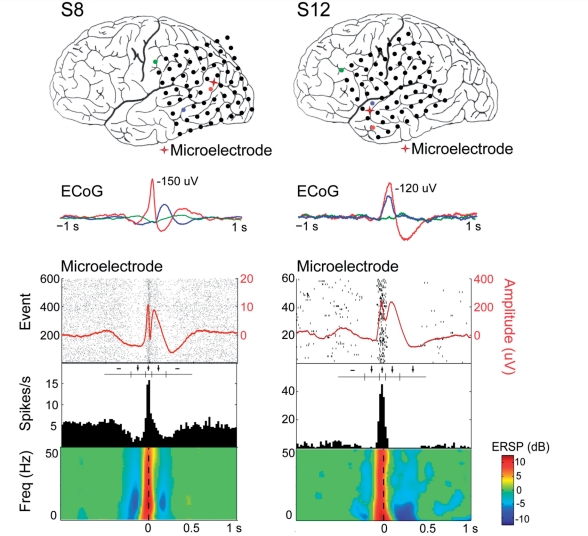
Figure 5.
Transient decrease in both local field potential spectral power and neuronal firing rates precede interictal discharges. Upper panels show the average LFP (red) overlaid on raster plots of neuronal firing. Below is the peri-event time histogram and then time-frequency plots of the LFP (non-significant values are plotted in green. Red indicates a significant increase and blue indicates a decrease (P < 0.01). The two columns are from two different patients.

