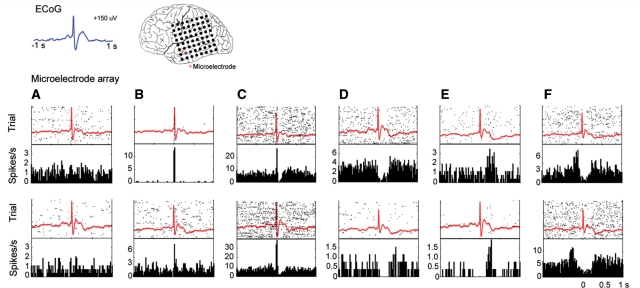
Figure 6.
Neuronal responses are variable in a small cortical region. All 12 units in this analysis were found within 2.5 mm at the same depth in cortex and therefore, the same cortical layer. In each plot, the top panel shows the raster plot (60 events) overlaid with the average local field potential. The lower panel shows the peri-event time histogram. Each column shows examples of similar firing patterns in two different units. Neuronal responses to the interictal discharge were seen that (A) did not change, (B) increased during the fast component, (C) increased during the fast component and decreased during the slow wave, (D) did not change during the fast component but decreased during the wave, (E) increased after the IID peak and wave, and (F) increased before the fast component of the interictal discharge.

