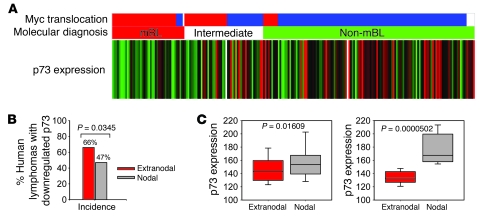
Figure 7. Correlation between p73 downregulation and dissemination in mature aggressive human lymphomas.
(A) Expression of the TP73 gene in 221 human cases of mature aggressive B lymphomas analyzed in ref. 40. Cases with p73 downregulation (green), upregulation (red), or no change (black) compared with the average p73 expression of all 221 cases are indicated. White, not available. The middle bar indicates classification by molecular diagnosis according to ref. 40; molecular Burkitt lymphoma (red); intermediate (white); non-mBL (green). The top bar indicates the presence or absence of Myc translocation; positive (red); negative (blue); not available (white). (B) Incidence of human extranodal and nodal lymphomas with downregulated p73. (C) Relative levels of p73 mRNA expression in extranodal (E×N) versus nodal (N) human lymphomas. Box plot analyses based on all E×N (n = 65) and N (n = 66) lymphomas (left), or E×N (n = 43) and N (n = 31) lymphomas (right) classified as exhibiting greater than 2-fold downregulation of p73 with respect to the entire 221 case cohort. The horizontal line within the boxes indicates the median expression level, with the lower and upper box representing the 25th and 75th percentile, respectively. Whiskers demarcate the 10th and 90th percentile.

