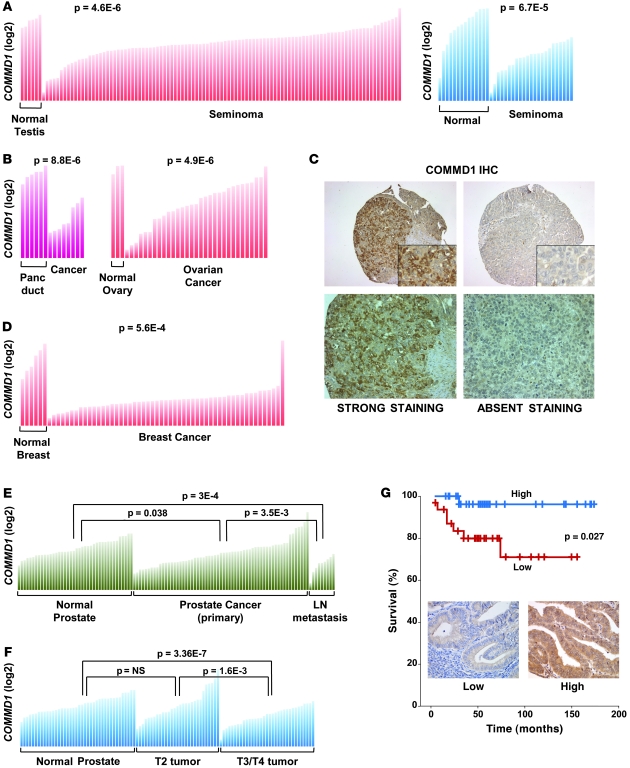
Figure 1. Decreased COMMD1 expression is found in several cancers.
(A and B) COMMD1 expression in individual samples from normal tissues or the corresponding cancer is shown (as normalized expression in log2 scale). Comparisons between groups were performed using the Student’s t test, with P values indicated in each panel. Panc duct, pancreatic duct. (C) Lack of detectable COMMD1 protein expression is frequent in ovarian cancer. Representative examples of COMMD1 immunohistochemical (IHC) staining of ovarian cancer specimens are shown (original magnification, ×200 [top panels]; ×600 [insets]; ×400 [bottom panels]). (D) COMMD1 expression in stromal cells from normal breast tissue and breast cancer is shown in a similar format as in A. (E) COMMD1 expression in normal prostate, prostate cancer, and metastatic prostate cancer specimens from lymph nodes is shown. Comparisons between groups were performed using the Student’s t test, with P values indicated. (F) COMMD1 expression in the same sample set, this time subdivided according to the local tumor T stage. Similar to A, the Student’s t test was performed to compare the groups, and P values are shown. (G) COMMD1 expression by immunohistochemical staining correlates with patient survival in endometrial cancer (n = 63). The survival curves of patients with intense cytoplasmic staining (high, blue curve) and weak/absent nucleocytoplasmic staining (low, red curve) are compared. Representative images (original magnification, ×400) are included.

