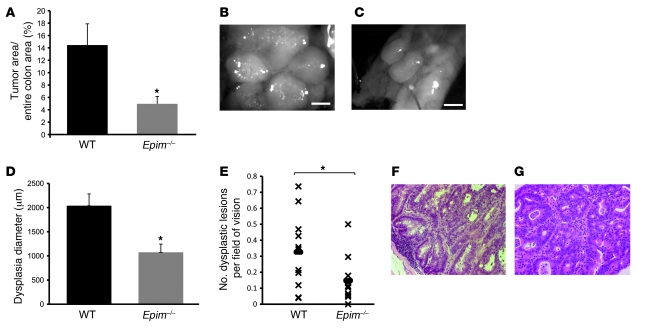
Figure 1. Protection from tumorigenesis in Epim–/– mice.
(A) Tumor load was decreased in AOM/DSS-treated Epim–/– versus WT mice. Data are expressed as percent of total colonic surface area with tumor: WT, 14.45% (n = 11); Epim–/–, 4.96% (n = 11). (B and C) Reduced polyposis in Epim–/– compared with WT mice. (B) Polyps in WT mice coalesced together with minimal normal intervening colonic mucosa. (C) In contrast, polyps in Epim–/– mice were separated by normal mucosa, and lesions had distinct boundaries. Scale bars: 625 μm. (D) Reduced dysplastic lesion diameter in Epim–/– mice. Sections were stained with H&E, and the diameter of each area of dysplasia was measured: Epim–/–, 1,075 μm (n = 11); WT, 2,040 μm (n = 11). (E) Reduced number of dysplastic lesions per field of vision in Epim–/– mice: Epim–/–, 0.15 (n = 11); WT, 0.33 (n = 11). (F and G) H&E staining of dysplastic mucosa from WT (F) and Epim–/– (G) descending colon. Original magnification, ×200. *P < 0.05.

